信息图
信息图 GPT Image 2 提示词:Academic Economics Chart Simulation
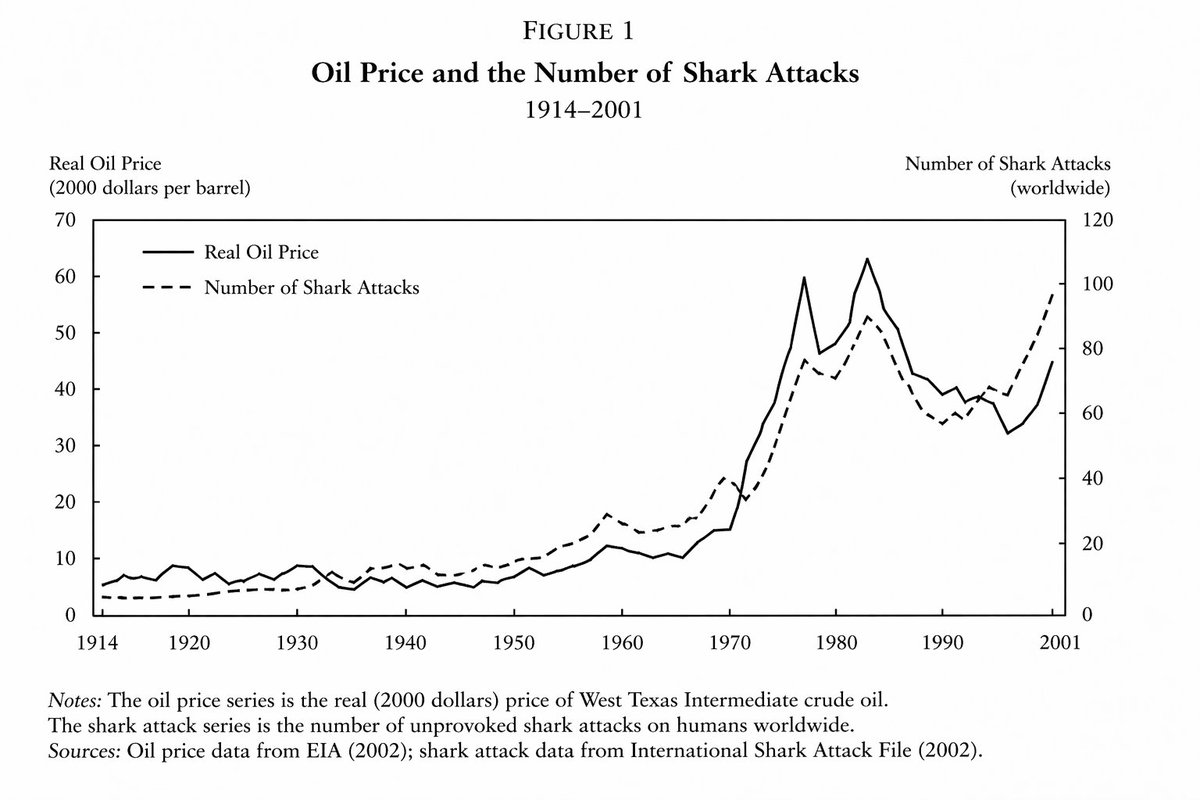
A prompt designed to generate highly realistic but fictitious academic charts, specifically showing a correlation between oil prices and shark attacks in an economics paper style.
📝 提示词
line graph from an important and prestigious {argument name="field" default="economics paper"} demonstrating a close but not exact relationship between {argument name="variable one" default="the price of oil"} and {argument name="variable two" default="the number of shark attacks"} between {argument name="time period" default="the years of 1914 and 2001"}
🎯 适合场景
适合做图解、清单、路线图和知识长图:先锁定信息层级,再把文字量控制在模型能稳定处理的范围里。
💡 改写建议
- 先替换变量里的品类、人物、城市、品牌色,不急着改整段结构。 把主体、构图和风格分开写,后续微调会更稳。