信息图
信息图 GPT Image 2 提示词:Editorial Dual-Axis Data Infographic
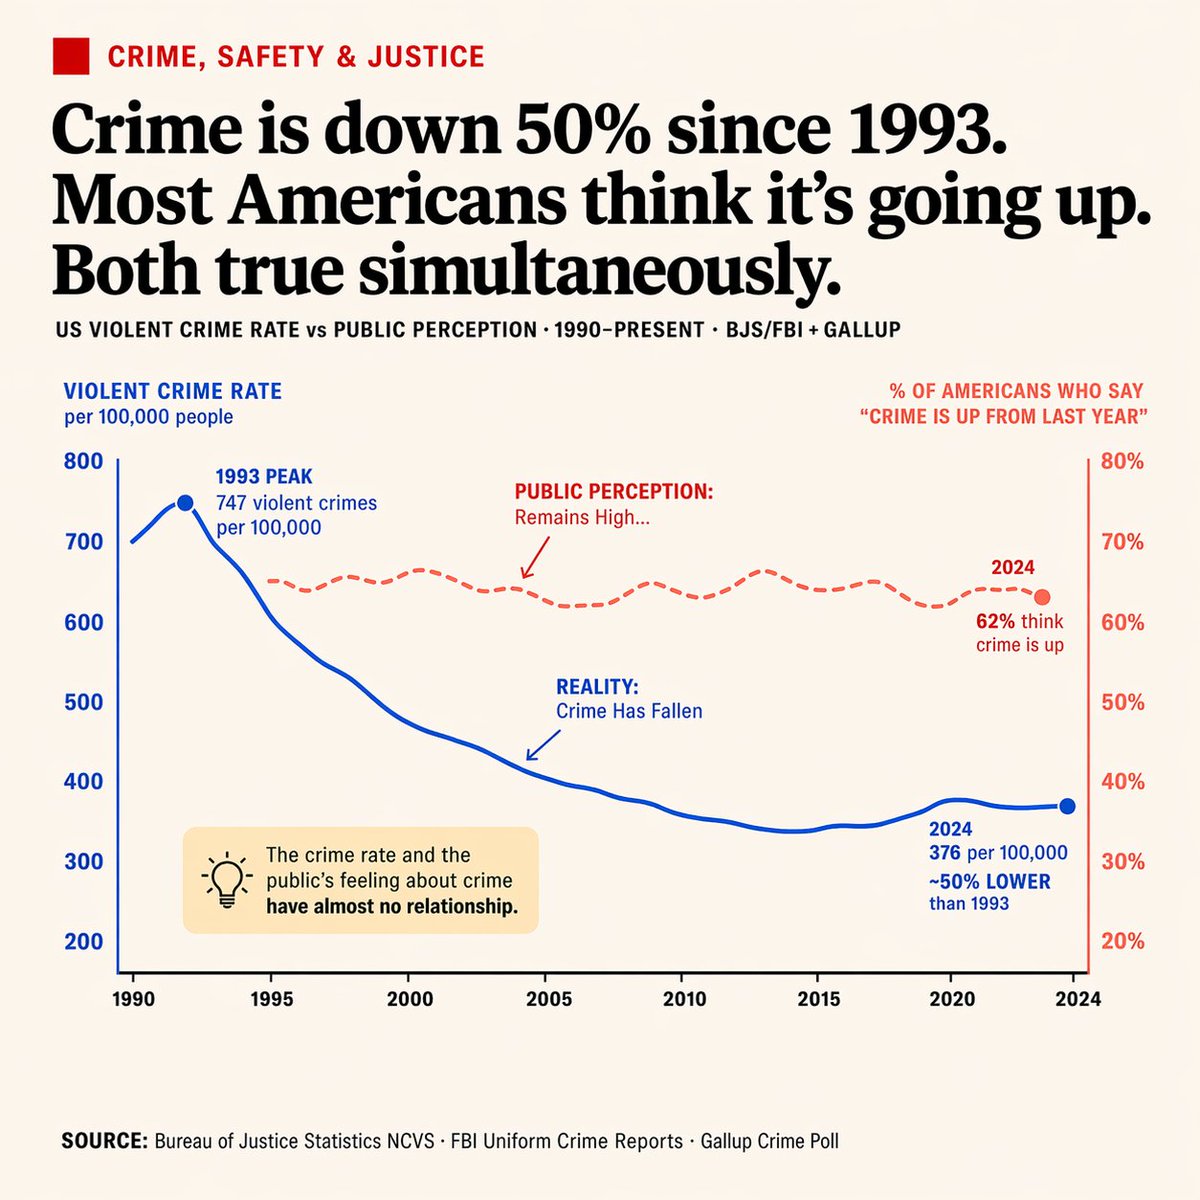
Generates a clean, newspaper-style dual-axis line chart with annotations and a callout box, ideal for comparing contrasting data trends.
📝 提示词
{
"type": "editorial infographic dual-axis line chart",
"style": "clean, newspaper-style, off-white background, highly legible typography",
"header": {
"category": "CRIME, SAFETY & JUSTICE (red text with red square icon)",
"headline": "{argument name="main headline" default="Crime is down 50% since 1993. Most Americans think it's going up. Both true simultaneously."}",
"sub_headline": "US VIOLENT CRIME RATE vs PUBLIC PERCEPTION · 1990-PRESENT · BJS/FBI + GALLUP"
},
"chart": {
"x_axis": "Years 1990 to 2024 with 8 tick marks",
"left_y_axis": {
"color": "blue",
"label": "{argument name="left axis label" default="VIOLENT CRIME RATE per 100,000 people"}",
"range": "200 to 800"
},
"right_y_axis": {
"color": "red",
"label": "{argument name="right axis label" default="% OF AMERICANS WHO SAY 'CRIME IS UP FROM LAST YEAR'"}",
"range": "20% to 80%"
},
"data_series": [
{
"name": "Reality",
"style": "solid blue line",
"trend": "peaks early then drops significantly",
"annotations": [
"1993 PEAK 747 violent crimes per 100,000 (with blue dot)",
"REALITY: Crime Has Fallen (with blue arrow pointing to line)",
"2024 376 per 100,000 ~50% LOWER than 1993 (with blue dot)"
]
},
{
"name": "Public Perception",
"style": "dashed red line",
"trend": "remains relatively flat and high",
"annotations": [
"PUBLIC PERCEPTION: Remains High... (with red arrow pointing to line)",
"2024 62% think crime is up (with red dot)"
]
}
]
},
"callout_box": {
"position": "bottom left inside chart area",
"style": "light yellow rectangle",
"icon": "lightbulb",
"text": "{argument name="callout text" default="The crime rate and the public's feeling about crime have almost no relationship."}"
},
"footer": {
"text": "SOURCE: {argument name="footer source" default="Bureau of Justice Statistics NCVS · FBI Uniform Crime Reports · Gallup Crime Poll"}"
}
}
🎯 适合场景
适合做图解、清单、路线图和知识长图:先锁定信息层级,再把文字量控制在模型能稳定处理的范围里。
💡 改写建议
- 先替换变量里的品类、人物、城市、品牌色,不急着改整段结构。 把主体、构图和风格分开写,后续微调会更稳。