信息图
界面稿
信息图 GPT Image 2 提示词:Editorial Dual-Axis Line Chart
Generates a journalistic data visualization comparing two contrasting trends over time with callout boxes and editorial headlines.
📝 提示词
{
"type": "dual-axis line chart infographic",
"style": "editorial data visualization, matte paper texture background, clean journalistic design",
"typography": {
"headline": "serif font, bold, centered",
"labels": "sans-serif, clean, uppercase and sentence case mix"
},
"layout": {
"header": {
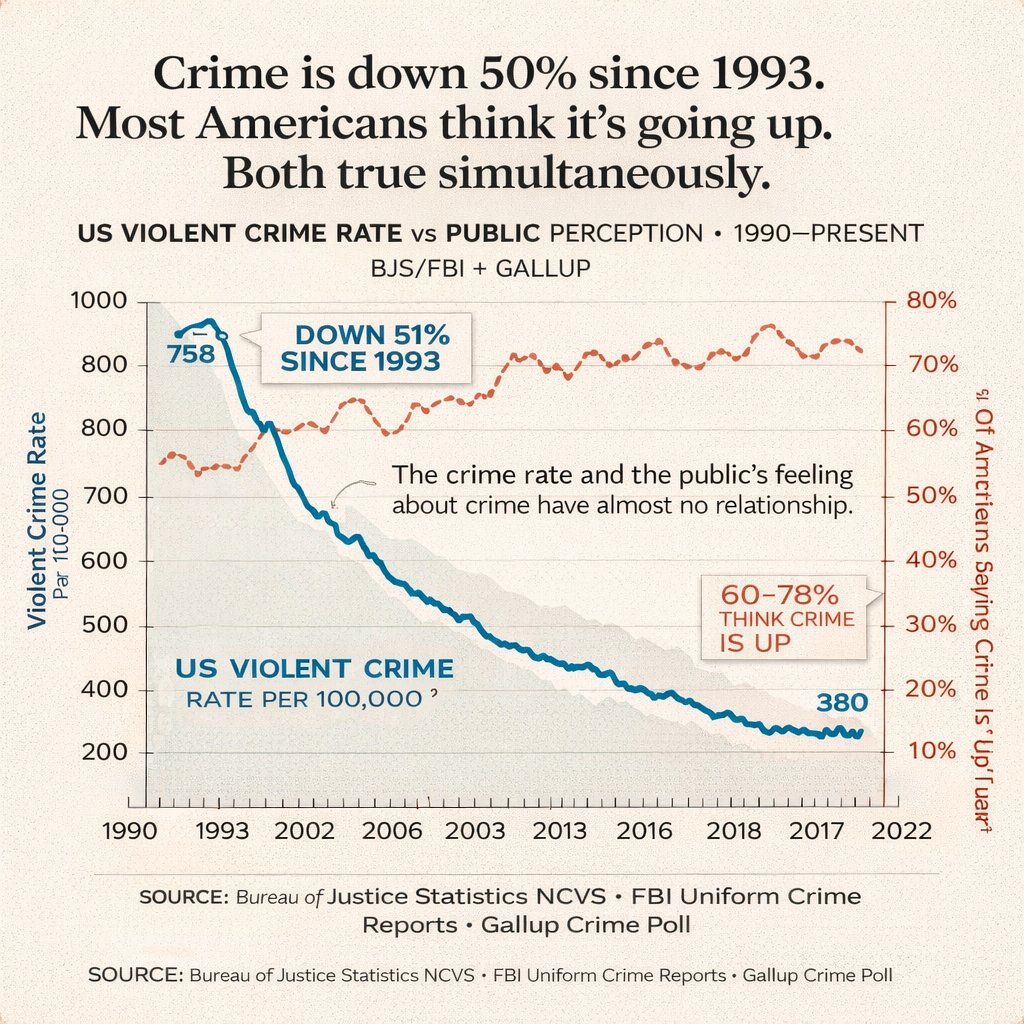
"main_title": "{argument name="main headline" default="Crime is down 50% since 1993. Most Americans think it's going up. Both true simultaneously."}",
"subtitle": "US VIOLENT CRIME RATE vs PUBLIC PERCEPTION • 1990–PRESENT BJS/FBI + GALLUP"
},
"chart_area": {
"background": "light beige with faint horizontal grid lines",
"axes": {
"x_axis": {
"label": "Years",
"ticks": ["1990", "1993", "2002", "2006", "2003", "2013", "2016", "2018", "2017", "2022"]
},
"y_axis_left": {
"label": "{argument name="left axis label" default="Violent Crime Rate Par 100-000"}",
"scale": ["200", "400", "500", "600", "700", "800", "800", "1000"],
"color": "black"
},
"y_axis_right": {
"label": "{argument name="right axis label" default="% Of Americans Saying Crime Is 'Up'"}",
"scale": ["10%", "20%", "30%", "40%", "50%", "60%", "70%", "80%"],
"color": "dark red"
}
},
"data_series": [
{
"name": "Violent Crime Rate",
"style": "thick solid blue line with light grey shading underneath",
"trend": "starts high, drops sharply, then steadily declines",
"data_labels": ["758", "380"]
},
{
"name": "Public Perception",
"style": "dashed dark red/orange line with small circle markers",
"trend": "fluctuates but generally trends upwards, staying high"
}
],
"annotations": [
{
"text": "{argument name="blue line annotation" default="DOWN 51% SINCE 1993"}",
"style": "callout box with pointer, blue text",
"position": "top left, pointing to the blue line drop"
},
{
"text": "60-78% THINK CRIME IS UP",
"style": "callout box with pointer, red text",
"position": "mid right, pointing to the dashed red line"
},
{
"text": "{argument name="center insight text" default="The crime rate and the public's feeling about crime have almost no relationship."}",
"style": "floating text with a small squiggly arrow",
"position": "center, between the two lines"
}
]
},
"footer": {
"source_text": "SOURCE: Bureau of Justice Statistics NCVS • FBI Uniform Crime Reports • Gallup Crime Poll",
"repetition": "text is repeated twice at the bottom"
}
}
}
🎯 适合场景
适合做图解、清单、路线图和知识长图:先锁定信息层级,再把文字量控制在模型能稳定处理的范围里。
💡 改写建议
- 先替换变量里的品类、人物、城市、品牌色,不急着改整段结构。 把主体、构图和风格分开写,后续微调会更稳。