产品展示
信息图
界面稿
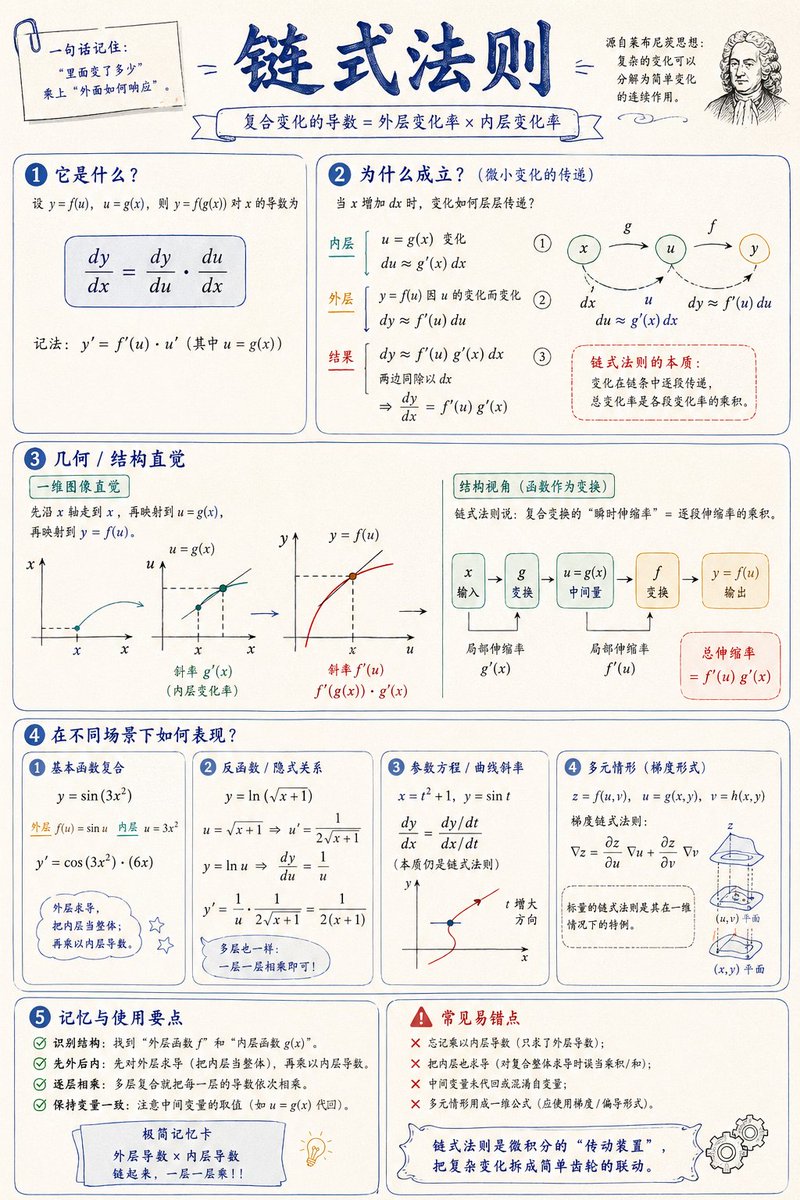
产品视觉 GPT Image 2 提示词:Mathematical Visualization Infographic Prompt
A prompt template for generating academic and visually appealing mathematical visualization infographics that explain complex concepts through hand-drawn style diagrams.
📝 提示词
Please create a mathematical visualization infographic about "{argument name="topic" default="mathematical concepts/knowledge points"}" to help readers intuitively understand: what it is, why it holds true, the geometric/structural intuition, and how it behaves in different scenarios. The image should look like a high-quality math lecture handout + hand-drawn educational poster—elegant, clear, and informative without being cluttered. Visual style: {argument name="layout" default="vertical or horizontal"}, clean light-colored paper background, dark blue headings, black/dark gray body lines, accented with a few elegant blue, turquoise, gold, and red colors. Use rounded-corner cards, thin borders, numbered labels, hand-drawn arrows, partial magnification boxes, and summary columns. The overall design should be aesthetic, balanced, and academic, allowing one to immediately grasp the "structure" and "reasoning" behind the concept.
🎯 适合场景
适合快速搭建产品图、包装展示和品牌海报:主体、材质、背景与商业修图方向已经有框架,换掉变量就能开跑。
💡 改写建议
- 先替换变量里的品类、人物、城市、品牌色,不急着改整段结构。 把主体、构图和风格分开写,后续微调会更稳。